Row 1
Somewhat long title of a very interesting poster |

|
|
|
Background: Although several workflows are currently available for academic poster preparation, none of them are ideal. Commonly, point-and-click software is used to arrange poster content, regardless of the analysis pipeline. Most of these software tools are propietary, thus trapping our content. Typical free and script based tools such as \(\LaTeX\) might not be appealing or seem as complex as using a point-and-click tool. This work shows a simple template to prepare posters in a free and reproducible workflow using R, rmarkdown, flexdashboard and webshot.
Row 2
Methods
Workflow
Dependencies
This poster template dependes on the following R packages
- rmarkdown (Allaire et al. 2017)
- flexdashboard (Allaire 2017)
- webshot (Chang 2016)
To use scripts/generic-content.R you will need a GNU/Linux system and a working installation of imagemagick.
Preparing your analysis environment
In order to use this poster template, you need to:
- Clone
odeleongt/flexdashboard-posterfrom github - Install the required packages
install.packages("rmarkdown", "flexdashboard", "webshot") - Install the PhantomJS library
webshot::install_phantomjs() - Edit the template to fit your needs
- Run
scripts/render-poster.R
Hosting your poster
You can host the poster generated by this template in GitHub pages by forking the repository, working on your local clone and checking out the contents of the output/ directory into the root directory of the gh-pages branch:
## Finish commiting your updates ...

## Move to gh-pages
git checkout gh-pages

## Only checkout specific files
git checkout master output/*

## Copy files and clean up
cp -r output/* . && rm -R output/*
rmdir output && git reset HEAD

## Add contents, commit and publish
git add *
git commit -m 'Update published poster'
git push origin gh-pages
Results
Here you would describe some amazing results. Since this poster is about making a poster, I show the last poster.
Fig. 1: Even the wisest cannot tell. For the mirror… shows many things… 
Reproducible results with R
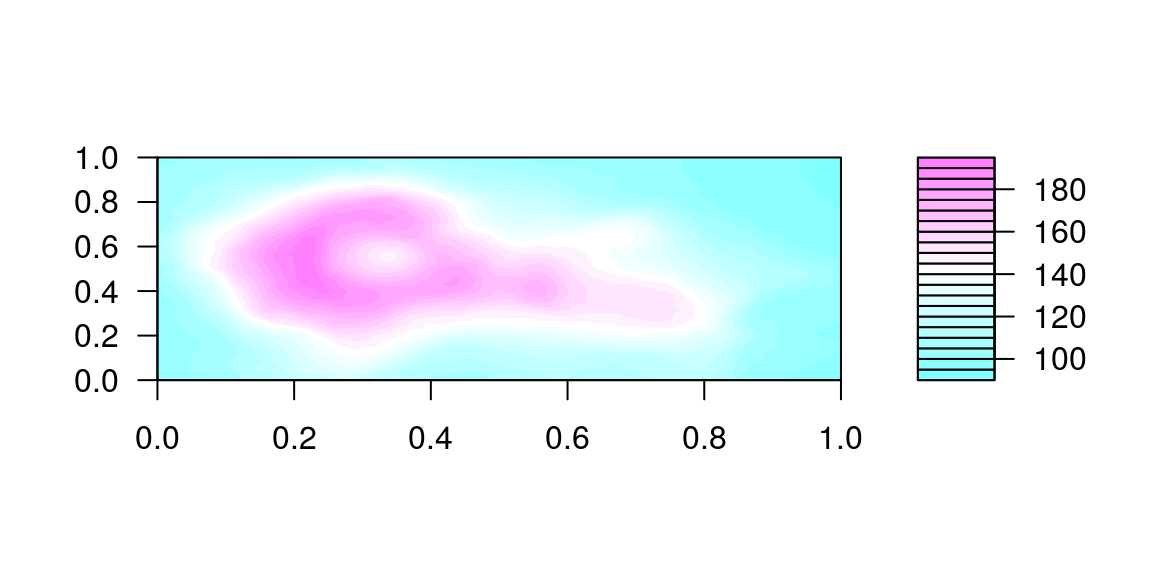
As we have come to expect, results from R computations can be included as well. Since adjusting figure positions will be almost always necesary, figures are by default saved to output/img/ and not shown on the poster. You need to manually include them using a tag as shown below.
**Fig. 1: Place the volcano figure where you please.**
<img src="img/volcano-plot-1.png" style="width:100%"></img>
Output for printing
A png file is produced by scripts/render-poster.R. By default it is set to use a 300ppi resolution and A1 size. For now, some testing is necessary to adjust scale and poster size.
Discussion
Since there are so many tools that can be used to prepare posters, and not a single one satisfies my needs, I prepared this other tool to… nah it still is missing things.
Fig. 3: Some authoritative content 
Limitations
Since the png file is generated as a snapshot of the html poster, several limitations should be considered:
- Resolution is very limited by the resources in your system
- Larger formats require much more resources to render
- Complex posters can take longer to load, so you have to try different delays
- The preview shown in
poster/poster_frame.htmlcould be very different to the final rendered image - “I can’t fit enough text/figures!”
↑ that one’s on you, nobody likes a crammed poster
Contact information
Oscar de León
odeleon@ces.uvg.edu.gt
https://github.com/odeleongt
Aknowledgements:
The time had come to face the fact that I was long overdue posting this template.
The time has come to face the fact that I must create a poster. It's been a while. What's the least painful way to do this these days?
— Kara Woo April 24, 2017
Row 3
Fig. 2: Place the volcano figure where you please.

References
Allaire, JJ. 2017. Flexdashboard: R Markdown Format for Flexible Dashboards. https://CRAN.R-project.org/package=flexdashboard.
Allaire, JJ, Joe Cheng, Yihui Xie, Jonathan McPherson, Winston Chang, Jeff Allen, Hadley Wickham, Aron Atkins, Rob Hyndman, and Ruben Arslan. 2017. Rmarkdown: Dynamic Documents for R. http://rmarkdown.rstudio.com.
Chang, Winston. 2016. Webshot: Take Screenshots of Web Pages. https://CRAN.R-project.org/package=webshot.
